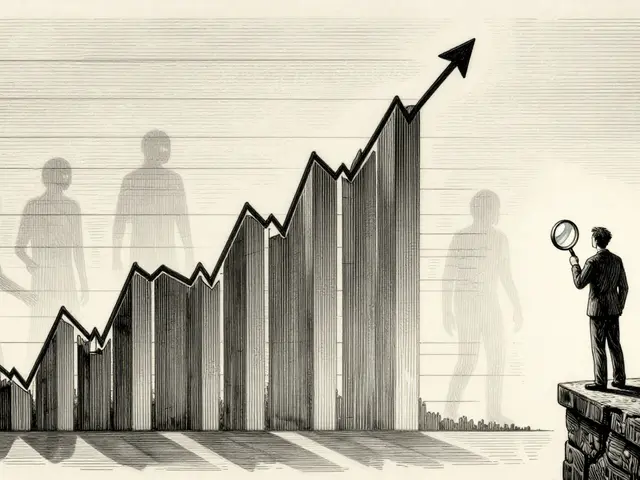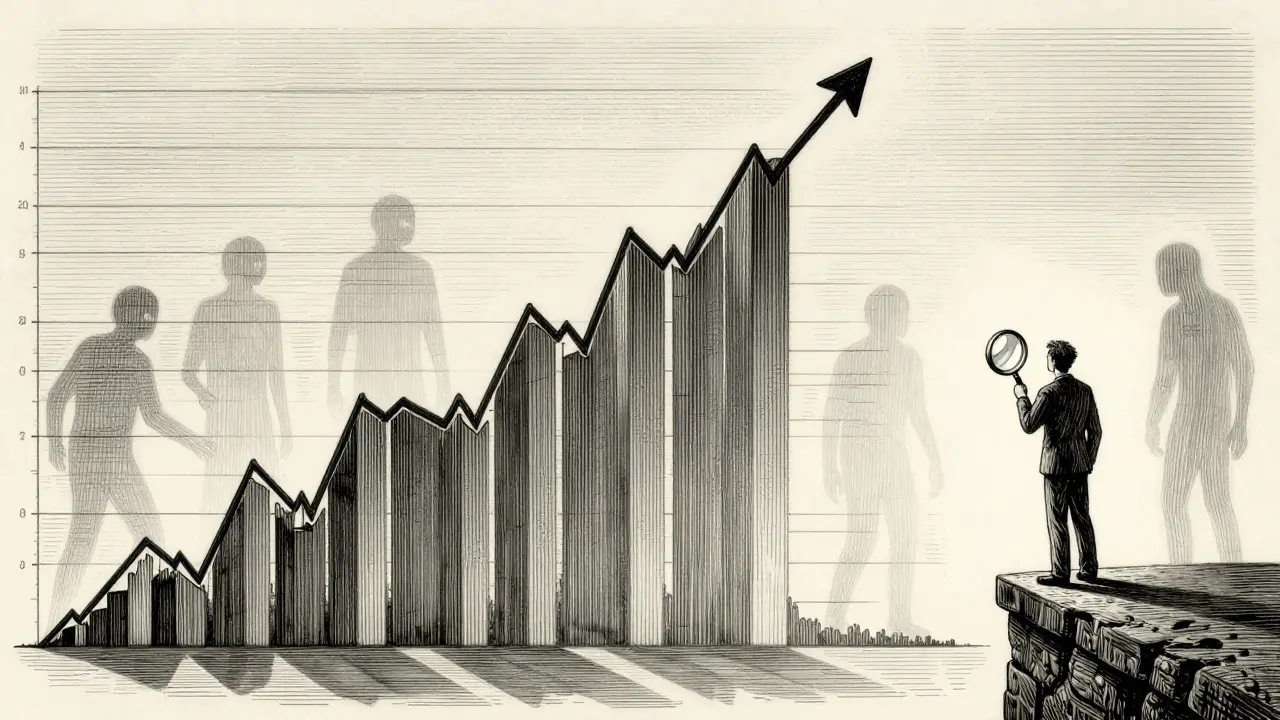
When you look at a cryptocurrency price chart, you’re not just seeing random lines going up and down. You’re seeing the collective behavior of thousands of traders-fear, greed, hesitation, and conviction-all written in price. Chart patterns are the visual language of market psychology. They repeat because human nature doesn’t change, even in the wild world of crypto.
Why Chart Patterns Matter in Crypto
Crypto markets move fast. Prices can swing 20% in an hour. That kind of volatility makes it hard to predict what’s next. But chart patterns help. They’re not magic. They’re patterns that have shown up again and again over decades-first in stocks, then in forex, and now in Bitcoin, Ethereum, and every altcoin you can trade. These patterns work because they reflect how traders react to price levels. When a coin hits a price it’s bounced off before, people remember. They buy or sell based on that memory. That’s what creates the shapes you see: triangles, flags, heads and shoulders. The key? Not every pattern works. But when you combine them with volume and trend context, your odds improve. Many traders lose money because they chase every pattern they see. The smart ones wait for confirmation.Three Main Types of Crypto Chart Patterns
Chart patterns fall into three buckets: continuation, reversal, and neutral. Each tells a different story about what’s coming next.- Continuation patterns mean the trend is taking a breath before moving again. Think of them as pause buttons.
- Reversal patterns signal the trend might be dying. These are your early warning signs.
- Neutral patterns don’t clearly favor up or down. They need context to be useful.
Triangle Patterns: The Most Common Crypto Signal
Triangles are the bread and butter of crypto charting. They show up on 15-minute charts and daily charts alike. And they’re easy to spot once you know what to look for. There are three kinds:- Ascending Triangle: Flat top, rising bottom. Buyers are stepping in stronger each time. This usually breaks up. Look for volume to spike when it does.
- Descending Triangle: Flat bottom, falling top. Sellers are pushing harder. Breakdowns here often lead to big drops.
- Symmetrical Triangle: Both sides are sloping inward. The market is undecided. Breakouts can go either way-but they usually follow the prior trend.
Flag and Pennant Patterns: Short-Term Power Moves
Flags and pennants are like sprinters catching their breath. They follow a sharp move-called the "pole"-and then pause before continuing.- Bull Flag: After a strong rally, price pulls back in a small downward channel. It looks like a flag on a flagpole. When it breaks above the channel, it often rockets higher. Target? Measure the pole’s height and add it to the breakout point.
- Bear Flag: Same shape, but reversed. After a sharp drop, price rallies in a small channel. Break below? Expect more downside.
- Bullish Pennant: Similar to a bull flag, but the channel slopes downward. The lines converge. It’s a tighter, faster version of a flag.
- Bearish Pennant: Downward pole, then a small upward channel with converging lines. Breakout down means more pain.
How to Trade These Patterns Like a Pro
Patterns alone aren’t enough. You need a plan. Step 1: Identify the trend. Is Bitcoin in a bull market? Then look for bullish flags and ascending triangles. In a bear market? Focus on descending triangles and bear flags. Step 2: Wait for confirmation. Don’t jump in when the pattern forms. Wait for the breakout candle to close beyond the trendline. A candle closing above the triangle’s top? That’s your signal. Step 3: Set your stop loss. For an ascending triangle, place your stop just below the lowest point of the pattern. For a bull flag, put it below the flag’s low. This limits your risk. Step 4: Set your target. Measure the height of the pole (for flags/pennants) or the widest part of the triangle. Add that distance to your breakout point. That’s your profit target. Step 5: Check volume. No volume spike? The breakout might fail. High volume? That’s real momentum. Most traders ignore step 5. That’s why they lose.What Patterns Don’t Tell You
Chart patterns are powerful, but they’re not perfect. They’re tools, not crystal balls. Here’s what they can’t do:- They won’t warn you about a sudden regulatory crackdown.
- They won’t tell you if a major exchange is about to delist a coin.
- They won’t predict a whale dumping 500 BTC in one trade.
AI Is Changing the Game
You don’t have to stare at charts for hours anymore. Tools like AltFINS scan 26 different patterns across dozens of crypto pairs 24/7. They flag setups you might miss-like a Gartley pattern on a 4-hour chart of Solana while you’re asleep. But don’t let AI do all the work. Use it as a filter. Let the software find candidates. Then you decide: Is the volume right? Is the trend strong? Is the market in a bull phase? Automation helps. But judgment still wins.Start Simple. Practice. Then Scale.
If you’re new to chart patterns, start here:- Choose one coin-Bitcoin or Ethereum.
- Look at its daily chart for the past 6 months.
- Find every triangle, flag, or pennant.
- Write down what happened after each breakout.
- Did volume confirm it? Did price reach the target?
Final Tip: Patterns Work Best in Context
A triangle on a 15-minute chart during a sideways market? Probably useless. That same triangle on a daily chart, after a 40% rally, with rising volume? That’s a high-probability setup. Timeframe matters. Market context matters. Volume matters. Your discipline matters most. Crypto won’t slow down. But you can learn to read it. Start with one pattern. Master it. Then add another. You don’t need to know all 26 patterns. You just need to know one well enough to make money.Are crypto chart patterns reliable?
Chart patterns are reliable when used with confirmation-especially volume and trend context. They’re not guarantees. Many fail, especially on low timeframes. But when they form on daily charts with strong volume and align with the broader market trend, they have a high success rate. Traders who combine patterns with other tools see better results than those who rely on patterns alone.
Which chart pattern is the most profitable in crypto?
There’s no single "most profitable" pattern. Ascending triangles and bull flags tend to perform best in bull markets because they signal continuation. In bear markets, descending triangles and bear flags are more reliable. Profitability depends on timing, volume, and market conditions-not just the pattern shape. The key is consistency: find the pattern that works best in your chosen timeframe and stick with it.
Can I trade crypto chart patterns on mobile?
Yes, many trading apps like TradingView, Binance, and Kraken support chart patterns on mobile. You can draw trendlines, spot flags and triangles, and set alerts. But mobile trading has limits. It’s harder to analyze volume and context on a small screen. Use mobile for alerts and quick checks, but make final decisions on a desktop with full chart tools.
How long does it take to learn crypto chart patterns?
You can learn to recognize basic patterns like triangles and flags in a few weeks. But mastering them-knowing when to trade, when to wait, and how to manage risk-takes months of practice. Most successful traders spend 3 to 6 months studying charts daily before they start trading with real money. The goal isn’t speed. It’s accuracy.
Do crypto chart patterns work in all market conditions?
No. Patterns work best in trending markets-either strong bull or bear phases. In sideways or choppy markets, they often give false signals. For example, a flag might form, but without a strong pole or volume confirmation, it’ll likely fail. Always check the bigger picture. If the overall market is range-bound, avoid chasing breakout patterns.